Speed reduction zones

Summary
Aalborg is testing speed reduction zones as an instrument to improve safety and perceptions of safety.
Implementing sustainable mobility
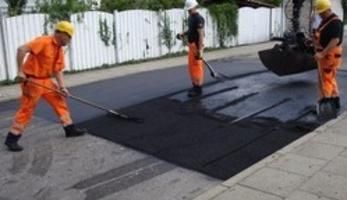
Speed reduction zones were foreseen in Aalborg’s Traffic Safety Plan and the Speed Action Plan from 2005. The city introduced five limited speed zones in the city, where the speed limit was reduced to 30 or 40 km/h. Different speed reducing measures such as bumps, bollards and signage are being tested.
The main objective of the measure is to:
- Enhance safety and perceptions of safety related to speed.
Cyclists are especially exposed to accidents and injuries when speed levels are high. In fact, the accident rate in the project area is higher than the average in the city. Aalborg is therefore making efforts to improve safety for cyclists, especially as the number of cyclists is increasing.
Progress
This measure focused in the experimental comparison between methods to implement new speed limits in the city of Aalborg, increasing the compliance with safe speed limits. The implementation of the speed limits are related to fullfilment of the goals of the Traffic Safety Plan 2008.
Objectives are related to the reduction of roadside accidents, the increase of pedestrian’s and cyclist’s safety and also the safety perception of security both for families with children, other residents, cyclists and also drivers. Results previewed are the reduction of 3 to 4km/h till 10 km/h in the CIVITAS corridor, and the decreasing of speeding.
The city has in 5 contiguous residential areas within the city implemented different strategies, through a colaborative work team (police, municipal technicians, and CIVITAS team). The initiatives in the different zones consist of:
- Zone 1 (30km/h): Signs, narrowing streets, bumps and bollards including some pre-existing speed reduction measures (30 km/h bumps and signage).
- Zone 2 (40km/h): Appropriate bumps, narrowing streets, signage and bollards.
- Zone 3 (30 and 40km/h): In both areas narrowing streets and appropriate bumps, two pillow bumps, signage and bollards were installed, inluding few pre-existing bumps.
- Zone 4 (40km/h): An entire speed reduction zone using only signage with a 40km/h limit.
- Zone 5 (40km/h): Besides a few pre-existing bumps, this zone relied only on new signs.
A total of 43 flexible bumps have been installed, 23 of 40 km/h speed reduction bumps and 18 of 30 km/h, plus two pillow bumps. Implementation has been completed in July 2010.
Outcomes
Evaluation has been focused in the measurement of speed levels with continued spools and mechanical car counts during a week in autumn 2009, spring 2010 and May 2011 within the experimental area. Society indicators have been compiled via the answers of two online surveys (Jul-Sept 2010 and Sept. 2011) about acceptance, awareness and perception of safety by area residents, anounced by a postal letter. The accidents have also been measured through police records, but the the time scope is too short to get proper conclusions.
Some results: people feeling unconfortable with letting their children walk alone in the street have decreased from 56% to 43% as an average in the 5 calming traffic areas. The share of people who were comfortable with letting their children travel in the traffic increased by 13% from 2010 to 2011. Accordingly, the share of people who felt discomfort with letting their children travel in the local area decreased by 16%. The ‘only signage’ zone has got the better rates in this issue.
Analysing the difference between zone 1, 2, 3 and 5 in combination (the zones where bumps and/or road narrowing were implemented) and zone 4 (the zone where only signs were implemented), shows a difference. The experienced speed reduction is more explicit in the zones, 1, 2, 3 and 5 combined.
Speed levels have been lowered in the main part of the measured roads within the five zones. The measurement shows that after the implementation of the speed reduction zones, speed level has increased only in minimal % on 3 roads. In the only signage zone, the speed has increased, indeed not surpassing the legal limits.An explanation could be the effect of the signage speed level. After the implementation of the speed reduction zone signs with 40 km/h were placed when entering the zone. Before this project there were no signs and people drove with the speed they felt was justifiable.