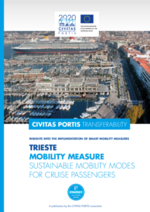
Trieste (Italy)
Trieste is situated towards the end of a narrow strip of Italian territory lying between the Adriatic Sea and Slovenia, which lies almost immediately south and east of the city. Built mostly on a hillside that becomes a mountain, Trieste’s urban territory lies at the foot of an imposing escarpment that comes down abruptly from the Karst Plateau towards the sea.
It has a dense network of bus lines connecting all of its neighbourhoods and is connected to the Karst plateau by an historic tram. There is also a regular daily ferry service between Trieste and Muggia.
| City area | 84.49 km2 | |
| Population | 203,825 inhabitants | |
| Population density | 2,412.4 inhabitants/km2 | |
| Climate | Mediterranean with continental influences | |
| Gender balance | Female 52%, male 48% | |
| Average life expectancy | Male 79.2; Female 83.9 | |
| Car ownership rate | 517 cars/1000 inhabitants | |
| Accident rate | 970 accidents in 2015 | |
| Economic sectors | Services (incl. port activity) Agriculture Manufacturing industry Population in the workforce Unemployment | 88% < 1% ≈ 11% 64.9% 8.1% |
| Income per capita | €22,209 (2014) | |
| Population ageing | One of the highest rates in EU 28,4 % over 65, of which 15,4% over 75. |
Modal Share

Car as driver (34.63%)
Bus (19.96%)
Car as passenger (11.42%)
Train (0.18%)
Other Public Transport (0.44%)
Motorbike/Moped/Scooter (13.12%)
Cycling (1.03%)
Walking (19.22%)
Challenges
- Integrate, from a mobility perspective, the port and the city with a special focus on the old port area, which recently became city-owned and represents an extraordinary opportunity of cooperation and waterfront development and growth.
- Improve the accessibility of the entire shoreline area, which connects the old port and the new port.
- Support the booming cruise business with adequate and sustainable urban mobility options for tourists.
Transport Infrastructure
Car network
Almost 360 kilometres

Cycling network
Almost 23 kilometres of cycle lanes

Public transport network
Almost 4,6 kilometres bus lanes
Almost 346 kilometres bus paths

Plans and policies
Trieste doesn't have a SUMP established according to the EU guidelines, but an Urban Traffic Master Plan approved by the city council in 2013. It came into force after a complex process of participation by citizens and stakeholders. It points to a more sustainable urban mobility. Among the aspects that characterize the plan there is the assumption of a scale of values between the different components of mobility which encourages the weaker users: pedestrian and bicycle mobility in the first place, public transport and, finally, private traffic and parking.
Among the major changes proposed in the plan there is the establishment of new pedestrian areas and walking trails. These interventions also aim to pedestrian link between the main parking facilities surrounding the old town and the areas of greatest interest, in order to invite people in the historic center to leave the car in the end of the first row, where there are already several parking areas. This change of habits can lead to a significant improvement of the environmental conditions in the city center.
Great attention has been paid to the needs of certain groups and, in particular, the disabled persons, ensuring accessibility to the pedestrian axes for the vehicles serving the disabled, taxis, and emergency vehicles.
The plan also extended a development of bike lanes and pedestrian paths involving mainly the flat areas and the densely populated areas of the city. The plan also identifies some solutions to promote public transport, including a significant increase in reserved lanes / roads.
Trieste after PORTIS

- Number of port employees: +35% (3.500 → 4.725)
- Number of total employment in city: +5% (92.000 → 96.600)
- Unemployment rate in city: -9,2% (6,06% → 5,5%)
- Number of new jobs created thanks to docks redevelopment: +200
- Number of new businesses attracted thanks to port redevelopment: +20
- Number of city-port commuters by car: -10% (3.150 → 2.835)
- Commuting travel time (all modes, in minutes): -20% (25 → 20)
Modal share of PT, cycling and walking in city
- PT +15% (20% → 15%)
- Cycling +100% (1% → 2%)
- Walking +5,3% (19% → 20%)
- Other (including car) -8,3% (60% → 55%)


